


The short version
Claim we investigated
Seattle's overdose deaths are still more than double their 2019 level, while U.S. overdose deaths have fallen below 2019.
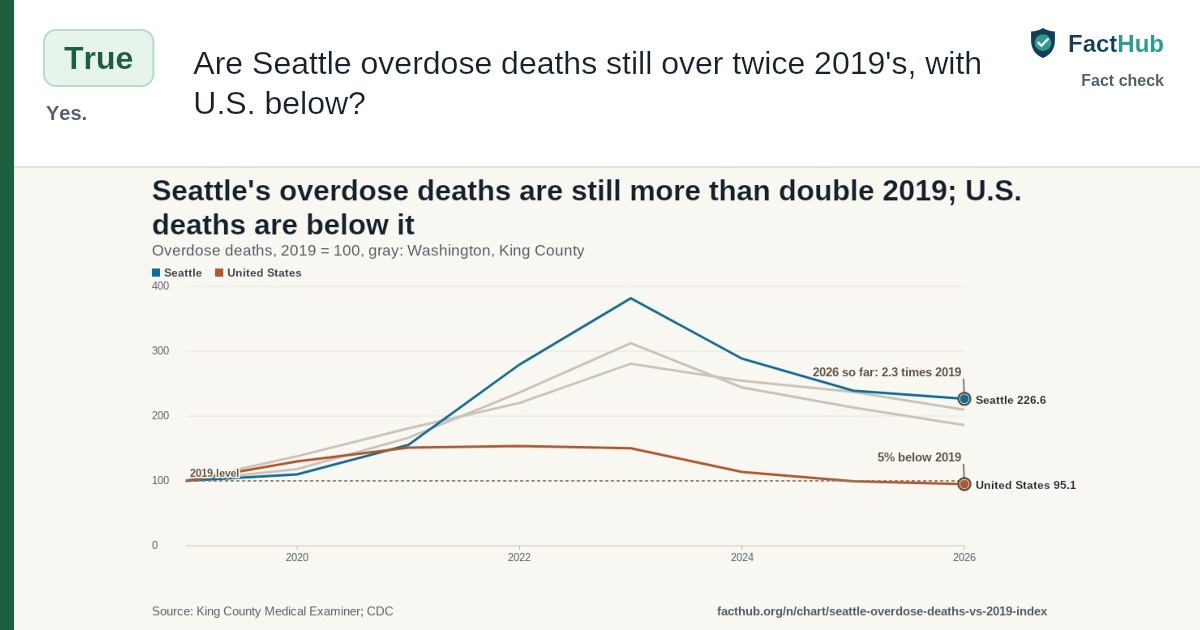
True. Seattle had 2.4 times as many overdose deaths in 2025 as in 2019; U.S. deaths have fallen just below 2019. Seattle had 478 overdose deaths in 2025 against 200 in 2019, and 392 so far in 2026 against 173 by the same date in 2019. U.S. deaths in 2025 were just under 2019's, and 5% under in the latest 12 months.
Quote or cite this fact-check
FactHub rates the claim “Seattle's overdose deaths are still more than double their 2019 level, while U.S. overdose deaths have fallen below 2019” True (high confidence): Seattle had 2.4 times as many overdose deaths in 2025 as in 2019; U.S. deaths have fallen just below 2019. Reviewed November 13, 2026. https://facthub.org/n/article/seattle-overdose-deaths-double-2019/3
Key points
What the evidence establishes
- Established. Deaths in Seattle rose from 200 in 2019 to 478 in 2025, 2.4 times. No resident count exists; King County residents' deaths also doubled.
- Established. From January 1 to November 13, 2026, Seattle had 392 overdose deaths, 2.3 times the 173 by that date in 2019.
- Established. U.S. overdose deaths in 2025 were 70,646, just under 2019's 71,130, and 5% below 2019 in the latest 12 months.
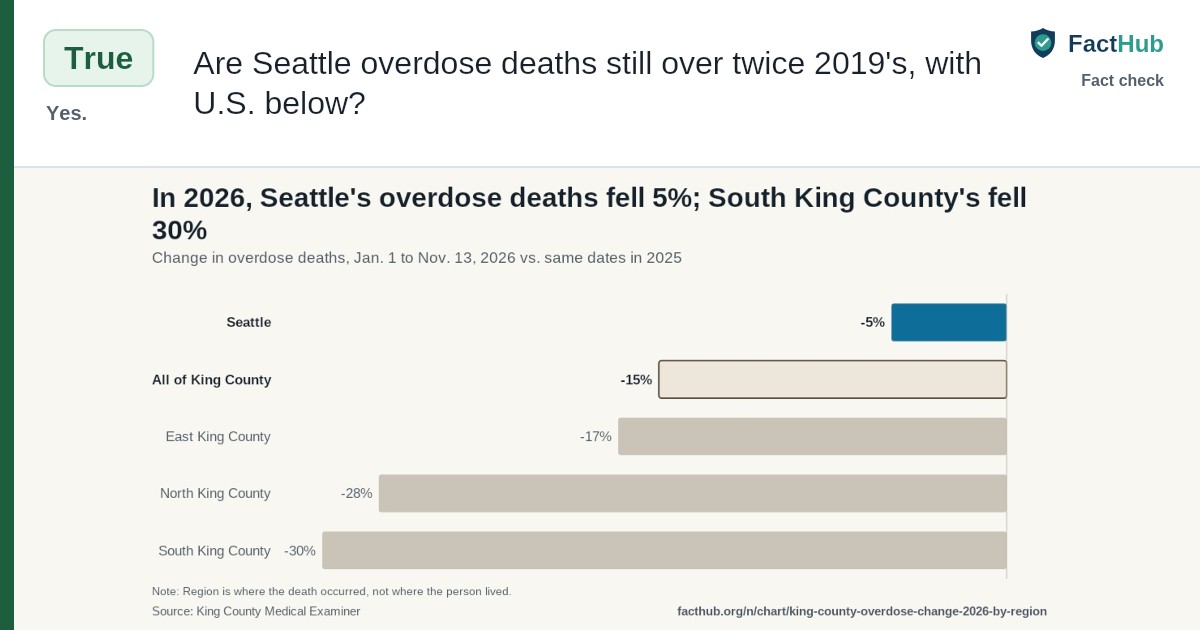
- Context. In 2026 Seattle's deaths fell only 5% from 2025, while South King County's, in the suburbs south of Seattle, fell 30%.
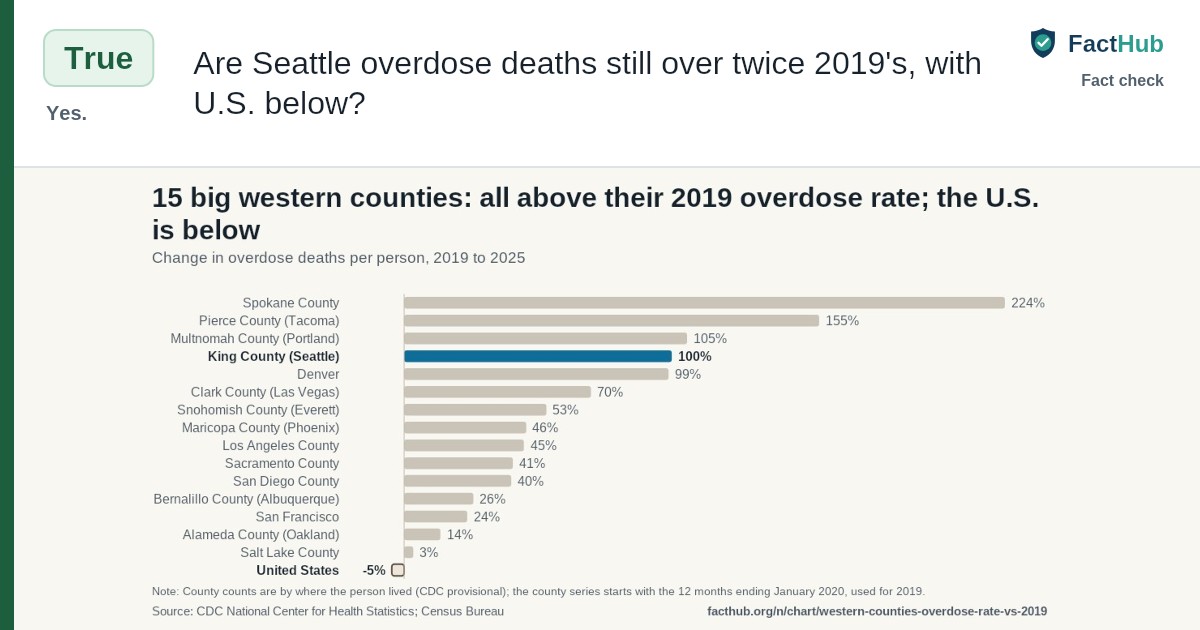
- Context. The rise is partly regional: all 15 large western counties we compared were above their 2019 rate in 2025.
- Context. Seattle's 2025 count was 37% below its 2023 peak, about as far as U.S. deaths fell from their 2022 peak.
The evidence
The conclusion rests on the combined record. Expand each item to see its role and limitations.
| Method | Institution / country | Year(s) | What it shows | Key limitation | Primary links |
|---|---|---|---|---|---|
| Read the King County Fatal Overdose Dashboard's yearly and year-to-date counts for its Seattle region on November 13, 2026 | King County Medical Examiner's Office, Public Health - Seattle & King County United States | 2019, 2023, 2025, 2026 | The King County Medical Examiner counted 200 overdose deaths in Seattle in 2019 and 478 in 2025, 2.4 times as many. The count peaked at 763 in 2023. From January 1 to November 13, 2026, it counted 392, against 173 for the same dates in 2019, or 2.3 times. Seattle now has 57% of the county's overdose deaths, up from 47% in 2019. | The county counts deaths that happen in Seattle, including people who live elsewhere. The 2026 count includes suspected overdoses still waiting on toxicology tests, and the county's figures are hover text from a dashboard that updates weekly. | Public Health - Seattle & King County and King County Medical Examiner's Office FactHub Research Team Public Health - Seattle & King County and King County Medical Examiner's Office Public Health - Seattle & King County |
| Downloaded CDC's provisional 12-month counts for the U.S. and Washington through June 2026 from data.cdc.gov on November 13, 2026 | CDC National Center for Health Statistics United States | 2019, 2022, 2025, 2026 | CDC counted 71,130 overdose deaths in the U.S. in 2019 and 70,646 in 2025, slightly fewer. In the 12 months to June 2026, the latest it reports, there were 64,433: about 5% fewer than in the 12 months to June 2019 (4.9%) and about 13% fewer than a year earlier (12.8%). National deaths peaked at 109,413 in 2022. Washington, by contrast, had 2.4 times its 2019 count in 2025. | These are CDC's reported provisional counts, which can rise as investigations close, and CDC marks the latest period as underreported. Its predicted counts, which adjust for late reports, are 65,724 for the 12 months to June 2026 and 68,322 for the same months of 2019, still 3.8% lower. The 2025 figure is close enough to 2019 that final data could narrow that gap. The counts include a few hundred deaths a year of people who don't live in the U.S. | FactHub Research Team FactHub Research Team CDC National Center for Health Statistics CDC National Center for Health Statistics CDC National Center for Health Statistics CDC National Center for Health Statistics |
| Divided the county and CDC counts by Census population estimates for 2019 and 2025, and read the dashboard's age-adjusted rates | U.S. Census Bureau, King County Medical Examiner's Office United States | 2019, 2025 | Population growth doesn't explain either side. The U.S. rate fell from 21.7 to 20.7 overdose deaths per 100,000 people from 2019 to 2025. Seattle's age-adjusted rate, the county's own figure, rose from 25.1 to 53.1, or 2.1 times. King County's rate was about twice its 2019 level and Washington's 2.3 times. | Seattle's rate divides deaths that happen in Seattle, including those of people who live elsewhere, by Seattle's population. Rates for the U.S., Washington and King County use Census estimates from two different releases. | FactHub Research Team |
| Read the dashboard's January 1 to November 13 counts for each region for 2019, 2025 and 2026 | King County Medical Examiner's Office United States | 2025, 2026 | From January 1 to November 13, overdose deaths fell 5% in Seattle from 2025 to 2026 (413 to 392). They fell 30% in South King County (297 to 207), 28% in North and 17% in East, and 15% across the county. So Seattle's share of the county's overdose deaths rose from 51% to 57%. The county notes that deaths among people living outside, in shelters or vehicles, or in housing service sites typically happen in Seattle. | This compares parts of one county in one year. North and East have few deaths, so their changes swing widely. The data don't say why Seattle is falling more slowly. | FactHub Research Team Public Health - Seattle & King County and King County Medical Examiner's Office FactHub Research Team |
| Downloaded CDC's provisional county counts for 15 large western counties and divided by Census population estimates | CDC National Center for Health Statistics, U.S. Census Bureau United States | 2019, 2025 | We compared overdose death rates in 15 large western counties, using CDC counts by where people lived. All 15 were higher in 2025 than in 2019. King County's rate doubled, 4th of the 15. Spokane (up 224%) and Pierce (up 155%) rose more; Portland's Multnomah County and Denver rose about as much. San Francisco rose 24% from a much higher 2019 rate. | CDC's county series starts with the 12 months ending January 2020, which we use for 2019. These counts are by where people lived, unlike the county's Seattle count, and CDC does not report cities. We chose the counties; others might rank differently. | FactHub Research Team CDC National Center for Health Statistics FactHub Research Team |
| Read the county dashboard's methods report and CDC's documentation for both overdose datasets | Public Health - Seattle & King County, CDC National Center for Health Statistics United States | 2026 | The county's Seattle count and CDC's national and state counts both count deaths where they happen. In a 2017 comparison the county cites, its medical examiner count ran 14% above state death records for King County. That was largely because some people who die there live elsewhere, and the extra deaths were more often among homeless people. Each place in this check is compared only with itself, counted the same way in 2019 and since. | We found no published count of overdose deaths among Seattle residents, so we can't check Seattle's ratio on a residence basis. King County's residence-based count from CDC also doubled (408 to 848). | Public Health - Seattle & King County |
1. Seattle: 478 overdose deaths in 2025, against 200 in 2019 Read the King County Fatal Overdose Dashboard's yearly and year-to-date counts for its Seattle region on November 13, 2026
The King County Medical Examiner counted 200 overdose deaths in Seattle in 2019 and 478 in 2025, 2.4 times as many. The count peaked at 763 in 2023. From January 1 to November 13, 2026, it counted 392, against 173 for the same dates in 2019, or 2.3 times. Seattle now has 57% of the county's overdose deaths, up from 47% in 2019.
Limit: The county counts deaths that happen in Seattle, including people who live elsewhere. The 2026 count includes suspected overdoses still waiting on toxicology tests, and the county's figures are hover text from a dashboard that updates weekly.
Verify: King County Fatal Overdose Dashboard, Trends tab (updated November 13, 2026) 2026 so far, compared with 2019 and a year earlier (saved analysis) King County Fatal Overdose Dashboard, Geography and Trends tab notes Fatal Overdose Dashboard methods report
- The medical examiner counted 200 overdose deaths in Seattle in 2019, 47.1% of the county's. Public Health - Seattle & King County and King County Medical Examiner's Office
- It counted 478 overdose deaths in Seattle in 2025, 52.9% of the county's. Public Health - Seattle & King County and King County Medical Examiner's Office
- Seattle's count peaked at 763 in 2023. Public Health - Seattle & King County and King County Medical Examiner's Office · Qualifies
- From January 1 to November 13, 2026, it counted 392 overdose deaths in Seattle, 57.1% of the county's. Public Health - Seattle & King County and King County Medical Examiner's Office
- For the same dates in 2019 it counted 173 in Seattle. Public Health - Seattle & King County and King County Medical Examiner's Office
- Seattle had 392 from January 1 to November 13, 2026: 2.27 times the same dates of 2019 and 5.1% below 2025 (413). FactHub Research Team
- The dashboard counts overdose deaths by where they happened. Public Health - Seattle & King County and King County Medical Examiner's Office · Qualifies
- Recent counts include suspected overdoses still waiting on toxicology tests. Public Health - Seattle & King County · Qualifies
2. U.S.: just under 2019 in 2025, and 5% under in the latest 12 months Downloaded CDC's provisional 12-month counts for the U.S. and Washington through June 2026 from data.cdc.gov on November 13, 2026
CDC counted 71,130 overdose deaths in the U.S. in 2019 and 70,646 in 2025, slightly fewer. In the 12 months to June 2026, the latest it reports, there were 64,433: about 5% fewer than in the 12 months to June 2019 (4.9%) and about 13% fewer than a year earlier (12.8%). National deaths peaked at 109,413 in 2022. Washington, by contrast, had 2.4 times its 2019 count in 2025.
Limit: These are CDC's reported provisional counts, which can rise as investigations close, and CDC marks the latest period as underreported. Its predicted counts, which adjust for late reports, are 65,724 for the 12 months to June 2026 and 68,322 for the same months of 2019, still 3.8% lower. The 2025 figure is close enough to 2019 that final data could narrow that gap. The counts include a few hundred deaths a year of people who don't live in the U.S.
Verify: Overdose deaths compared with 2019 (saved analysis) 2026 so far, compared with 2019 and a year earlier (saved analysis) VSRR Provisional Drug Overdose Death Counts (dataset xkb8-kh2a) Provisional Drug Overdose Death Counts: dashboard and technical notes VSRR Provisional Drug Overdose Death Counts, U.S., 12 months ending June 2026 (API record) VSRR Provisional Drug Overdose Death Counts, U.S., 12 months ending June 2019 (API record)
- U.S. overdose deaths were 70,646 in 2025, just under the 71,130 of 2019 (99.3 on a 2019 = 100 scale). FactHub Research Team
- In the 12 months to June 2026 the U.S. had 64,433 overdose deaths, 4.9% below the 12 months to June 2019 (67,787) and 12.8% below a year earlier. FactHub Research Team
- U.S. deaths peaked at 109,413 in 2022; by 2025 they were 35% below that peak. Seattle's 2025 count was 37% below its 2023 peak of 763. FactHub Research Team · Qualifies
- In 2025, Washington's count was 2.37 times its 2019 count and King County's 2.13 times. FactHub Research Team
- Washington had 2,495 in the 12 months to June 2026, 2.1 times the 1,190 in the 12 months to June 2019, and 20.8% fewer than a year earlier. FactHub Research Team
- The national counts cover deaths that happen in the 50 states and DC. CDC National Center for Health Statistics · Qualifies
- Recent provisional counts can be too low because some causes of death are still under investigation. CDC National Center for Health Statistics · Qualifies
- CDC's provisional state and national counts are by where the death happened, the same basis as the county's. CDC National Center for Health Statistics · Qualifies
- CDC's predicted count for the 12 months ending June 2026, which adjusts for late reports, is 65,724. CDC National Center for Health Statistics · Qualifies
- CDC marks the reported count for that period as low because data are incomplete. CDC National Center for Health Statistics · Qualifies
- CDC's predicted count for the 12 months ending June 2019 is 68,322, so on predicted counts the latest 12 months are 3.8% lower. CDC National Center for Health Statistics
3. Per person, the gap is the same Divided the county and CDC counts by Census population estimates for 2019 and 2025, and read the dashboard's age-adjusted rates
Population growth doesn't explain either side. The U.S. rate fell from 21.7 to 20.7 overdose deaths per 100,000 people from 2019 to 2025. Seattle's age-adjusted rate, the county's own figure, rose from 25.1 to 53.1, or 2.1 times. King County's rate was about twice its 2019 level and Washington's 2.3 times.
Limit: Seattle's rate divides deaths that happen in Seattle, including those of people who live elsewhere, by Seattle's population. Rates for the U.S., Washington and King County use Census estimates from two different releases.
Verify: Deaths per 100,000 people, 2019 and 2025 (saved analysis)
- The U.S. rate fell from 21.7 to 20.7 overdose deaths per 100,000 people from 2019 to 2025, 0.95 times its 2019 level. FactHub Research Team
- Seattle's age-adjusted rate rose from 25.1 to 53.06 per 100,000, 2.11 times its 2019 level. FactHub Research Team
- King County's rate was 2.05 times 2019 (19.0 to 39.0), or 1.95 times on the county's age-adjusted rate; Washington's was 2.26 times (16.4 to 37.1). FactHub Research Team · Qualifies
4. In 2026, Seattle's deaths are falling far more slowly than the rest of King County's Read the dashboard's January 1 to November 13 counts for each region for 2019, 2025 and 2026
From January 1 to November 13, overdose deaths fell 5% in Seattle from 2025 to 2026 (413 to 392). They fell 30% in South King County (297 to 207), 28% in North and 17% in East, and 15% across the county. So Seattle's share of the county's overdose deaths rose from 51% to 57%. The county notes that deaths among people living outside, in shelters or vehicles, or in housing service sites typically happen in Seattle.
Limit: This compares parts of one county in one year. North and East have few deaths, so their changes swing widely. The data don't say why Seattle is falling more slowly.
Verify: King County regions, January 1 to November 13 (saved analysis) King County Fatal Overdose Dashboard, Geography and Trends tab notes 2026 so far, compared with 2019 and a year earlier (saved analysis)
- From 2025 to 2026 (January 1 to November 13), deaths fell 5.1% in Seattle, 17.2% in East King County, 27.8% in North, 30.3% in South and 15.4% countywide. FactHub Research Team
- Seattle's share of the county's overdose deaths for those dates rose from 50.9% in 2025 to 57.1% in 2026. FactHub Research Team
- Against the same dates of 2019, South King County is at 1.62 times and the whole county at 1.86 times; Seattle is at 2.27 times. FactHub Research Team · Qualifies
- From January 1 to November 13, 2026, it counted 207 overdose deaths in South King County. Public Health - Seattle & King County and King County Medical Examiner's Office
- King County had 686 from January 1 to November 13, 2026: 1.86 times the same dates of 2019 (369) and 15.4% below 2025 (811). FactHub Research Team · Qualifies
- The county says deaths among people living outdoors, in shelters or vehicles, or in housing service sites typically happen in Seattle. Public Health - Seattle & King County and King County Medical Examiner's Office · Qualifies
5. Other large western counties were also above 2019 Downloaded CDC's provisional county counts for 15 large western counties and divided by Census population estimates
We compared overdose death rates in 15 large western counties, using CDC counts by where people lived. All 15 were higher in 2025 than in 2019. King County's rate doubled, 4th of the 15. Spokane (up 224%) and Pierce (up 155%) rose more; Portland's Multnomah County and Denver rose about as much. San Francisco rose 24% from a much higher 2019 rate.
Limit: CDC's county series starts with the 12 months ending January 2020, which we use for 2019. These counts are by where people lived, unlike the county's Seattle count, and CDC does not report cities. We chose the counties; others might rank differently.
Verify: Large western counties: overdose death rates, 2019 and 2025 (saved analysis) VSRR Provisional County-Level Drug Overdose Death Counts (dataset gb4e-yj24) Washington's overdose death rate grew fastest of any state
- All 15 large western counties we compared had higher overdose death rates in 2025 than in 2019, from Salt Lake County (3% higher) to Spokane County (224% higher). FactHub Research Team · Qualifies
- King County's rate, by where people lived, doubled from 18.1 to 36.2 per 100,000 (408 deaths to 848), 4th of the 15; Spokane and Pierce rose more, Portland's Multnomah County and Denver about as much. FactHub Research Team · Qualifies
- San Francisco started from a much higher rate (46.1 per 100,000) and rose 24%, to 56.9. FactHub Research Team · Qualifies
- CDC's county counts are by the county where the person lived. CDC National Center for Health Statistics · Qualifies
- Almost all of Washington's rise came after 2019, and deaths involving fentanyl-type drugs doubled in 2020 and were 77% of the state's overdose deaths by 2023. FactHub Research Team · Qualifies
6. Where the death happened versus where the person lived Read the county dashboard's methods report and CDC's documentation for both overdose datasets
The county's Seattle count and CDC's national and state counts both count deaths where they happen. In a 2017 comparison the county cites, its medical examiner count ran 14% above state death records for King County. That was largely because some people who die there live elsewhere, and the extra deaths were more often among homeless people. Each place in this check is compared only with itself, counted the same way in 2019 and since.
Limit: We found no published count of overdose deaths among Seattle residents, so we can't check Seattle's ratio on a residence basis. King County's residence-based count from CDC also doubled (408 to 848).
Verify: Fatal Overdose Dashboard methods report
- In a 2017 evaluation the county cites, its medical examiner count ran 14% above state death records, largely because some people who die in King County live elsewhere. Public Health - Seattle & King County · Qualifies
- In that comparison, deaths in the medical examiner count but not in state records were more likely to be among homeless people. Public Health - Seattle & King County · Qualifies
Common questions 8
“Have Seattle's overdose deaths fallen about as much from their peak as U.S. deaths?”
Short answer: Yes, by 37% vs 35%
Seattle's 2025 count was 37% below its 2023 peak of 763; U.S. deaths were 35% below their 2022 peak. Seattle stays higher because its peak was far higher.
- Seattle's count peaked at 763 in 2023. Public Health - Seattle & King County and King County Medical Examiner's Office · Qualifies
- It counted 478 overdose deaths in Seattle in 2025, 52.9% of the county's. Public Health - Seattle & King County and King County Medical Examiner's Office
- U.S. deaths peaked at 109,413 in 2022; by 2025 they were 35% below that peak. Seattle's 2025 count was 37% below its 2023 peak of 763. FactHub Research Team · Qualifies
See the evidence: Seattle: 478 overdose deaths in 2025, against 200 in 2019
“Are Seattle's overdose deaths falling as fast in 2026 as the rest of King County's?”
Short answer: No: 5% vs 17% to 30%
No. From January 1 to November 13, Seattle's overdose deaths fell 5% from 2025, while East, North and South King County fell 17% to 30%. Seattle's share of the county's deaths rose from 51% to 57%.
- From 2025 to 2026 (January 1 to November 13), deaths fell 5.1% in Seattle, 17.2% in East King County, 27.8% in North, 30.3% in South and 15.4% countywide. FactHub Research Team
- Seattle's share of the county's overdose deaths for those dates rose from 50.9% in 2025 to 57.1% in 2026. FactHub Research Team
- From January 1 to November 13, 2026, it counted 207 overdose deaths in South King County. Public Health - Seattle & King County and King County Medical Examiner's Office
“Were all 15 large western counties we compared above their 2019 overdose death rate in 2025?”
Short answer: Yes, from 3% to 224% higher
Yes, all 15 had higher overdose death rates in 2025 than in 2019, from 3% higher in Salt Lake County to 224% in Spokane County; King County ranked 4th. In Washington, almost all of the rise came after 2019, as deaths involving fentanyl-type drugs doubled in 2020 (our state check). So Seattle's level is partly a regional pattern. What sets Seattle apart in 2026 is how slowly it is falling compared with the rest of King County.
- All 15 large western counties we compared had higher overdose death rates in 2025 than in 2019, from Salt Lake County (3% higher) to Spokane County (224% higher). FactHub Research Team · Qualifies
- King County's rate, by where people lived, doubled from 18.1 to 36.2 per 100,000 (408 deaths to 848), 4th of the 15; Spokane and Pierce rose more, Portland's Multnomah County and Denver about as much. FactHub Research Team · Qualifies
- Almost all of Washington's rise came after 2019, and deaths involving fentanyl-type drugs doubled in 2020 and were 77% of the state's overdose deaths by 2023. FactHub Research Team · Qualifies
- From 2025 to 2026 (January 1 to November 13), deaths fell 5.1% in Seattle, 17.2% in East King County, 27.8% in North, 30.3% in South and 15.4% countywide. FactHub Research Team
See the evidence: Other large western counties were also above 2019
“Are U.S. deaths really below 2019, or about the same?”
Short answer: Slightly below, and falling
Slightly below. U.S. deaths in 2025 were 70,646 against 71,130 in 2019, under 1% fewer. Per person they were 5% lower, and in the 12 months to June 2026 they were 5% below the same months of 2019 and still falling about 13% a year. Provisional counts can rise a little as cases close, so 2025 is close to even.
- U.S. overdose deaths were 70,646 in 2025, just under the 71,130 of 2019 (99.3 on a 2019 = 100 scale). FactHub Research Team
- The U.S. rate fell from 21.7 to 20.7 overdose deaths per 100,000 people from 2019 to 2025, 0.95 times its 2019 level. FactHub Research Team
- In the 12 months to June 2026 the U.S. had 64,433 overdose deaths, 4.9% below the 12 months to June 2019 (67,787) and 12.8% below a year earlier. FactHub Research Team
- Recent provisional counts can be too low because some causes of death are still under investigation. CDC National Center for Health Statistics · Qualifies
See the evidence: U.S.: just under 2019 in 2025, and 5% under in the latest 12 months
“Doesn't Seattle's count include people who don't live in Seattle?”
Short answer: Yes, both years
Yes. The county counts deaths that happen in Seattle, and Seattle's share of the county's deaths rose from 47% in 2019 to 57% in 2026, so some of the rise may be people from elsewhere dying in Seattle. But counted by where people lived, King County's deaths also doubled (408 to 848), which limits how much that shift could explain. No count of Seattle residents exists to check it directly.
- The dashboard counts overdose deaths by where they happened. Public Health - Seattle & King County and King County Medical Examiner's Office · Qualifies
- The medical examiner counted 200 overdose deaths in Seattle in 2019, 47.1% of the county's. Public Health - Seattle & King County and King County Medical Examiner's Office
- From January 1 to November 13, 2026, it counted 392 overdose deaths in Seattle, 57.1% of the county's. Public Health - Seattle & King County and King County Medical Examiner's Office
- King County's rate, by where people lived, doubled from 18.1 to 36.2 per 100,000 (408 deaths to 848), 4th of the 15; Spokane and Pierce rose more, Portland's Multnomah County and Denver about as much. FactHub Research Team · Qualifies
- In a 2017 evaluation the county cites, its medical examiner count ran 14% above state death records, largely because some people who die in King County live elsewhere. Public Health - Seattle & King County · Qualifies
See the evidence: Seattle: 478 overdose deaths in 2025, against 200 in 2019
“Does Seattle's population growth explain the rise?”
Short answer: No
No. Seattle's age-adjusted overdose death rate, which accounts for population size and age, rose from 25.1 to 53.1 per 100,000 from 2019 to 2025, 2.1 times. The U.S. rate fell from 21.7 to 20.7.
“Are the 2026 numbers final?”
Short answer: No
No. The county's 2026 count includes suspected overdoses still waiting on toxicology tests. CDC's counts run about six months behind and can rise as investigations close. Comparing January 1 to November 13 in each year keeps the windows the same.
- Recent counts include suspected overdoses still waiting on toxicology tests. Public Health - Seattle & King County · Qualifies
- Recent provisional counts can be too low because some causes of death are still under investigation. CDC National Center for Health Statistics · Qualifies
- From January 1 to November 13, 2026, it counted 392 overdose deaths in Seattle, 57.1% of the county's. Public Health - Seattle & King County and King County Medical Examiner's Office
See the evidence: Seattle: 478 overdose deaths in 2025, against 200 in 2019
“Why are Seattle's deaths falling more slowly than the rest of the county's?”
Short answer: The data don't say
The data don't say, and we didn't test causes. The county notes that deaths among people living outside, in shelters or in housing service sites typically happen in Seattle. Our check of deaths in subsidized housing found that about 1 in 4 of the county's overdose deaths so far in 2026 were in that housing. In 2019 it was 1 in 8.
- The county says deaths among people living outdoors, in shelters or vehicles, or in housing service sites typically happen in Seattle. Public Health - Seattle & King County and King County Medical Examiner's Office · Qualifies
- Seattle's share of the county's overdose deaths for those dates rose from 50.9% in 2025 to 57.1% in 2026. FactHub Research Team
- About 1 in 4 King County overdose deaths so far in 2026 were among people living in subsidized or supportive housing, up from 1 in 8 in 2019. FactHub Research Team · Qualifies
Conclusion
The claim is true as worded. Seattle had 478 overdose deaths in 2025, 2.4 times the 200 it had in 2019, and its age-adjusted rate per person was 2.1 times higher. So far in 2026 it is at 2.3 times 2019. U.S. overdose deaths, meanwhile, were just under their 2019 level in 2025 and about 5% below it in the latest 12 months CDC reports.
The national figure is a narrow win. In 2025 the U.S. was less than 1% below 2019 on raw counts, and provisional counts can rise a little. But it was 5% lower per person, and it is still falling fast, so the direction is clear.
Two facts cut the other way. First, Seattle is not unusual in the West. In Washington almost all of the rise came after 2019, as fentanyl took hold, and all 15 large western counties we compared were above their 2019 rates in 2025; King County ranked 4th. Second, Seattle has come down a long way: its 2025 count was 37% below its 2023 peak, about the same drop as the nation's from its 2022 peak.
What does stand out is 2026. Seattle's deaths are down only 5% from 2025, while other parts of King County fell 17% to 30%. The county says deaths among people living outside or in housing service sites tend to happen in Seattle. We did not test why Seattle is lagging, and the 2026 counts are still provisional.
We rate the claim True with high confidence. Seattle's counts, age-adjusted rate and 2026 figures all come from the county's one dashboard, so they are one source, not three. The independent check is CDC's death records by where people lived, which show King County's deaths doubling too (408 to 848), so the rise is not an artifact of the county's counting. For the U.S., the count and the per-person rate come from the same CDC figures, so they are one line of evidence, and both put 2025 below 2019. CDC's predicted counts, which adjust for late reports, still put the latest 12 months 3.8% below the same months of 2019.
How we checked
- We defined the claim as two comparisons with 2019: overdose deaths in Seattle, and overdose deaths in the U.S., each in 2025 and in the latest 2026 data.
- For Seattle we used the King County Medical Examiner's counts for its Seattle region, read from the county's Fatal Overdose Dashboard on November 13, 2026, for full years and for January 1 to November 13 of each year.
- For the U.S. and Washington we used CDC's provisional 12-month counts through June 2026, and compared the latest 12 months with the same months of 2019.
- We computed rates per 100,000 people with Census population estimates and read the county's own age-adjusted rates.
- To test whether Seattle is unusual, we compared King County's regions and 15 large western counties, using CDC county counts by where people lived.
- We read the county's and CDC's documentation on where deaths are counted and how provisional counts change, and recorded the limits in each evidence item.
Editorial note: This check covers overdose death counts and rates from 2019 through mid-November 2026. It does not judge what caused the rise, or which policies would lower it. The Seattle figures count deaths that happen in Seattle; no residence-based Seattle count was available. No external specialist review has been recorded.
Expert-review status
No external specialist review has been recorded.
Funding and conflicts
Funding: No external funding for this piece.
Ownership: Published by the FactHub Research Team.
Conflicts: None known.
Sources 15
Sources are labeled by kind, with what this fact check takes from each, so readers can check the evidence independently.
-
Government
Public Health - Seattle & King County and King County Medical Examiner's Office.
King County Fatal Overdose Dashboard, Trends tab (updated November 13, 2026)
The county's weekly dashboard of overdose deaths the medical examiner investigated, by year and by region. Figures are the dashboard's hover text, read November 13, 2026.
Reliability: Speaks against its own interest. The county health department and medical examiner publish their own case counts within days, including probable overdoses awaiting toxicology. The county also runs many of the programs these deaths are used to judge, so high counts run against its interest.
-
The medical examiner counted 200 overdose deaths in Seattle in 2019, 47.1% of the county's.
What the source says
In 2019, 200 overdose deaths occured among people in Seattle, accounting for 47.1% of all overdose deaths in King County.
Trends tab, Count, Region view, hover on Seattle 2019Not yet checked
-
It counted 478 overdose deaths in Seattle in 2025, 52.9% of the county's.
What the source says
In 2025, 478 overdose deaths occured among people in Seattle, accounting for 52.9% of all overdose deaths in King County.
Trends tab, Count, Region view, hover on Seattle 2025Not yet checked
-
Qualifies: Seattle's count peaked at 763 in 2023.
What the source says
In 2023, 763 overdose deaths occured among people in Seattle, accounting for 58.6% of all overdose deaths in King County.
Trends tab, Count, Region view, hover on Seattle 2023Not yet checked
-
From January 1 to November 13, 2026, it counted 392 overdose deaths in Seattle, 57.1% of the county's.
What the source says
Between Jan 1 and Nov 13 2026, 392 overdose deaths occured among people in Seattle, accounting for 57.1% of all overdose deaths in King County.
Trends tab, Count YTD, Region view, hover on Seattle 2026Not yet checked
-
For the same dates in 2019 it counted 173 in Seattle.
What the source says
Between Jan 1 and Nov 13 2019, 173 overdose deaths occured among people in Seattle, accounting for 46.9% of all overdose deaths in King County.
Trends tab, Count YTD, Region view, hover on Seattle 2019Not yet checked
-
-
Government
Public Health - Seattle & King County and King County Medical Examiner's Office.
King County Fatal Overdose Dashboard, Geography and Trends tab notes
The dashboard's own notes on what its counts measure and where deaths happen.
Reliability: Same county dashboard as above; these are its explanatory notes.
-
Qualifies: The dashboard counts overdose deaths by where they happened.
What the source says
*Count: Number of overdose deaths that occured
Geography tab, Customize this graph panel, Count noteNot yet checked
-
Qualifies: The county says deaths among people living outdoors, in shelters or vehicles, or in housing service sites typically happen in Seattle.
What the source says
Overdose deaths among people living outdoors, in a homeless shelter, or vehicle and people living at housing service sites typically occur in Seattle.
Geography tab, text beside the living-situation chartNot yet checked
-
From January 1 to November 13, 2026, it counted 207 overdose deaths in South King County.
What the source says
Between Jan 1 and Nov 13 2026, 207 overdose deaths occured among people in South King County, accounting for 30.2% of all overdose deaths in King County.
Trends tab, Count YTD, Region view, hover on South 2026Not yet checked
-
-
Government
Public Health - Seattle & King County.
Fatal Overdose Dashboard methods report
The dashboard's methods document: case definitions, data sources and how the counts compare with state death records.
Reliability: The county health department's description of its own data.
-
Qualifies: In a 2017 evaluation the county cites, its medical examiner count ran 14% above state death records, largely because some people who die in King County live elsewhere.
What the source says
The estimated number of overdose deaths occurring in King County is 14% greater when based upon the KCMEO data rather than the Vital Statistics data, which is largely due to discrepancies between the county of death versus county of residence indicated on the death certificate.
Overdose Death Case Definition, p. 2Not yet checked
-
Qualifies: In that comparison, deaths in the medical examiner count but not in state records were more likely to be among homeless people.
What the source says
Overdose deaths that met the MEO case definition but not the Vital Statistics definition were significantly more likely to have occurred among persons living homeless
Overdose Death Case Definition, p. 2Not yet checked
-
Qualifies: Recent counts include suspected overdoses still waiting on toxicology tests.
What the source says
Suspected overdose deaths with <2 consistent KCMEO toxicology results that are undergoing toxicology evaluation by WSP or NMS Laboratories are classified as "suspected overdose, pending toxicology"
Overdose Death Case Definition, p. 2Not yet checked
-
-
Government
CDC National Center for Health Statistics.
VSRR Provisional Drug Overdose Death Counts (dataset xkb8-kh2a)
Federal 12-month overdose death counts for the nation and each state, from death certificates, updated monthly.
Reliability: The federal statistics agency compiles death certificates from every state. Recent months are provisional and are revised as investigations close.
-
Qualifies: The national counts cover deaths that happen in the 50 states and DC.
What the source says
National provisional counts include deaths occurring within the 50 states and the District of Columbia as of the date specified and may not include all deaths that occurred during a given time period.
Dataset descriptionNot yet checked
-
Qualifies: Recent provisional counts can be too low because some causes of death are still under investigation.
What the source says
Provisional counts are often incomplete and causes of death may be pending investigation resulting in an underestimate relative to final counts.
Dataset descriptionNot yet checked
-
-
Government
CDC National Center for Health Statistics.
Provisional Drug Overdose Death Counts: dashboard and technical notes
The federal agency's explanation of its provisional overdose counts.
Reliability: Documentation for the CDC counts used here.
-
Qualifies: CDC's provisional state and national counts are by where the death happened, the same basis as the county's.
What the source says
Deaths are reported by the jurisdiction in which the death occurred.
Provisional Drug Overdose Death Counts, notes under the dashboardNot yet checked
-
-
Government
CDC National Center for Health Statistics.
VSRR Provisional County-Level Drug Overdose Death Counts (dataset gb4e-yj24)
Federal 12-month overdose death counts for each county by where the person lived, updated quarterly.
Reliability: Same federal death certificate system as the state counts; counts of 1 to 9 are hidden for privacy.
-
Qualifies: CDC's county counts are by the county where the person lived.
What the source says
The provisional data presented on the dashboard below include reported 12 month-ending provisional counts of death due to drug overdose by the decedent’s county of residence and the month in which death occurred.
Dataset descriptionNot yet checked
-
-
FactHub record
FactHub Research Team.
Overdose deaths compared with 2019 (saved analysis)
Each place's yearly overdose deaths as a percent of its own 2019 deaths, from the county and CDC counts above.
-
U.S. overdose deaths were 70,646 in 2025, just under the 71,130 of 2019 (99.3 on a 2019 = 100 scale).
Not yet checked
-
Qualifies: U.S. deaths peaked at 109,413 in 2022; by 2025 they were 35% below that peak. Seattle's 2025 count was 37% below its 2023 peak of 763.
Not yet checked
-
In 2025, Washington's count was 2.37 times its 2019 count and King County's 2.13 times.
Not yet checked
-
-
FactHub record
FactHub Research Team.
2026 so far, compared with 2019 and a year earlier (saved analysis)
The latest 2026 window for each place against the same months of 2019 and of the year before.
-
In the 12 months to June 2026 the U.S. had 64,433 overdose deaths, 4.9% below the 12 months to June 2019 (67,787) and 12.8% below a year earlier.
Not yet checked
-
Washington had 2,495 in the 12 months to June 2026, 2.1 times the 1,190 in the 12 months to June 2019, and 20.8% fewer than a year earlier.
Not yet checked
-
Qualifies: King County had 686 from January 1 to November 13, 2026: 1.86 times the same dates of 2019 (369) and 15.4% below 2025 (811).
Not yet checked
-
Seattle had 392 from January 1 to November 13, 2026: 2.27 times the same dates of 2019 and 5.1% below 2025 (413).
Not yet checked
-
-
FactHub record
FactHub Research Team.
Deaths per 100,000 people, 2019 and 2025 (saved analysis)
Rates from the county and CDC counts and Census population estimates, and the county's own age-adjusted rates.
-
The U.S. rate fell from 21.7 to 20.7 overdose deaths per 100,000 people from 2019 to 2025, 0.95 times its 2019 level.
Not yet checked
-
Seattle's age-adjusted rate rose from 25.1 to 53.06 per 100,000, 2.11 times its 2019 level.
Not yet checked
-
Qualifies: King County's rate was 2.05 times 2019 (19.0 to 39.0), or 1.95 times on the county's age-adjusted rate; Washington's was 2.26 times (16.4 to 37.1).
Not yet checked
-
-
FactHub record
FactHub Research Team.
King County regions, January 1 to November 13 (saved analysis)
Medical examiner counts by region for 2019, 2025 and 2026, with changes.
-
From 2025 to 2026 (January 1 to November 13), deaths fell 5.1% in Seattle, 17.2% in East King County, 27.8% in North, 30.3% in South and 15.4% countywide.
Not yet checked
-
Qualifies: Against the same dates of 2019, South King County is at 1.62 times and the whole county at 1.86 times; Seattle is at 2.27 times.
Not yet checked
-
-
FactHub record
FactHub Research Team.
Large western counties: overdose death rates, 2019 and 2025 (saved analysis)
CDC county counts by where the person lived, divided by Census population, for 15 large western counties.
-
Qualifies: All 15 large western counties we compared had higher overdose death rates in 2025 than in 2019, from Salt Lake County (3% higher) to Spokane County (224% higher).
Not yet checked
-
Qualifies: King County's rate, by where people lived, doubled from 18.1 to 36.2 per 100,000 (408 deaths to 848), 4th of the 15; Spokane and Pierce rose more, Portland's Multnomah County and Denver about as much.
Not yet checked
-
Qualifies: San Francisco started from a much higher rate (46.1 per 100,000) and rose 24%, to 56.9.
Not yet checked
-
-
FactHub record
FactHub Research Team.
Are more of King County's overdose deaths in subsidized housing?
An earlier FactHub fact check of where King County's overdose deaths happen.
-
FactHub record
FactHub Research Team.
Washington's overdose death rate grew fastest of any state
An earlier FactHub fact check of Washington's overdose death growth from 2014 to 2024.
-
Qualifies: Almost all of Washington's rise came after 2019, and deaths involving fentanyl-type drugs doubled in 2020 and were 77% of the state's overdose deaths by 2023.
Not yet checked
-
-
Government
CDC National Center for Health Statistics.
VSRR Provisional Drug Overdose Death Counts, U.S., 12 months ending June 2026 (API record)
The dataset's own record for the U.S. in the latest 12-month period, with CDC's reported and predicted counts.
Reliability: The same CDC dataset as above, read through its public API. The predicted value is CDC's own adjustment for deaths still being reported.
-
Qualifies: CDC's predicted count for the 12 months ending June 2026, which adjusts for late reports, is 65,724.
What the source says
"predicted_value":"65724"
API record, predicted_value fieldNot yet checked
-
Qualifies: CDC marks the reported count for that period as low because data are incomplete.
What the source says
"footnote":"Underreported due to incomplete data."
API record, footnote fieldNot yet checked
-
-
Government
CDC National Center for Health Statistics.
VSRR Provisional Drug Overdose Death Counts, U.S., 12 months ending June 2019 (API record)
The dataset's record for the U.S. in the same months of 2019.
Reliability: The same CDC dataset as above, read through its public API.
-
CDC's predicted count for the 12 months ending June 2019 is 68,322, so on predicted counts the latest 12 months are 3.8% lower.
What the source says
"predicted_value":"68322"
API record, predicted_value fieldNot yet checked
-
-
FactHub dataset
Seattle, King County, Washington and U.S. overdose deaths compared with 2019
-
Tables: annual-deaths
Saved analysis index-2019
-
Tables: latest-vs-2019
Saved analysis latest-vs-2019
-
Tables: per-capita
Saved analysis per-capita
-
Tables: kc-regions-ytd
Saved analysis regions-table
-
Tables: western-counties
Saved analysis western-counties-table
-
- FactHub chart seattle-overdose-deaths-vs-2019-index
- FactHub chart king-county-overdose-change-2026-by-region
- FactHub chart western-counties-overdose-rate-vs-2019
Update history 3 changes, last
- Link previews now show the rating with the lead chart.
- First version.
- Key point 1 now says Seattle's count is deaths that happen in Seattle and that King County residents' deaths also doubled (feedback 2516076635928172701-60e9100038804cc5b0c048c18b6c72ca). The common question on where people lived now addresses Seattle's rising share of the county's deaths (2516076635932506934-fa09dcf2a3b176b109e25d23ac3cbeaf). The U.S. evidence adds CDC's predicted counts, which adjust for late reports, and the conclusion treats U.S. counts and rates as one line of evidence (2516076635935195640-abc2113ee22d03f4aba5b9d75eb04fa8, 2516076635930379319-7847209d77805a4e097fabf2c21ecf6b).
Feedback these versions applied
- Version 2 Skeptic, 4 findings
Cited by
Version details
The exact citing versions, and the version of this article each cites.
-
Briefing
seattle-homelessness-addiction— version 3 (published)cites version 3
For developers: ClaimReview data
This page includes standardized ClaimReview metadata describing the exact claim, FactHub's finding, publisher, and review dates. You can inspect the record below and confirm that it matches the article you just read.
View ClaimReview JSON
{"@context":"https://schema.org","@type":"ClaimReview","url":"https://facthub.org/n/article/seattle-overdose-deaths-double-2019","datePublished":"2026-11-14","dateModified":"2026-11-15","author":{"@type":"Organization","name":"FactHub","url":"https://facthub.org/"},"claimReviewed":"Seattle\u0027s overdose deaths are still more than double their 2019 level, while U.S. overdose deaths have fallen below 2019.","reviewRating":{"@type":"Rating","alternateName":"True"},"image":"https://facthub.org/node-assets-v2/article/seattle-overdose-deaths-double-2019/3/img-skyline/social-1200x630.jpg"}This metadata helps machines discover the fact-check. It does not prove the conclusion or guarantee special treatment by a search engine.
Challenge this fact-check
Every source above is linked so you can check it yourself. Identify the specific conclusion you dispute and provide verifiable evidence that could change it. Credible challenges deserve review and a visible response.
Submit evidence Send general feedback insteadTechnical details: node handle article:seattle-overdose-deaths-double-2019